| |
|
|
|
|
|
|
|
|
|
|
|
|
|
|
| |
Alberta Electric System Operator |
|
|
|
|
| |
Pool Weekly Summary: July 21, 2013 to July 27,
2013 |
|
|
|
|
| |
|
|
|
|
|
|
|
|
|
|
|
|
|
|
| |
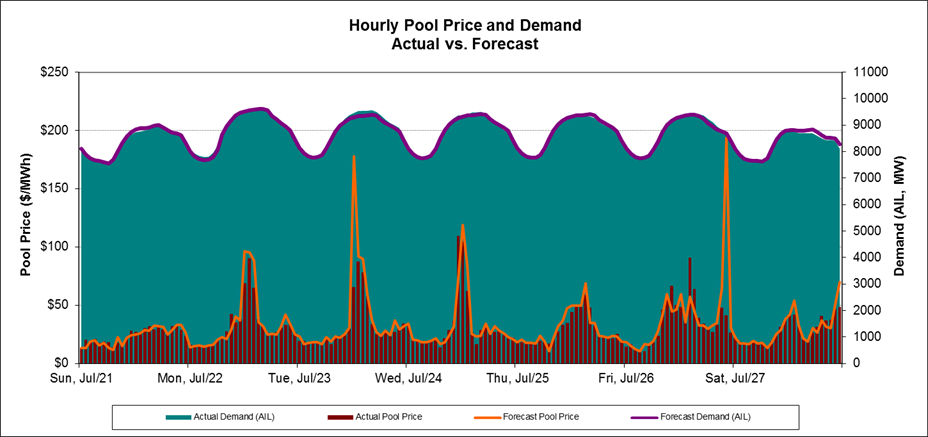
For
the week of Sun. Jul-21, 2013 to Sat. Jul-27, 2013, pool price averaged
$30.48/MWh. This is 41% lower than the
prior week's average pool price of $51.85/MWh. The maximum pool price during the week was
$109.48/MWh and occured on Wed, Jul-24 HE 12 when demand was 9,369 MW. This is $693.67/MWh lower than the prior
week's maximum pool price of $803.15/MWh. |
|
|
|
|
| |
|
|
|
|
| |
|
|
|
|
| |
|
|
|
|
| |
Total
energy for the week was 1,451 GWh.
This is 0.2% lower than the prior week's total energy of 1,455
GWh. The weekly peak demand was 9,576
MW and occurred on Mon, Jul-22 HE 14, pool price for that hour was
$90.44/MW. This week's peak demand is
1.5% lower than the prior week's peak demand of 9,723 MW. |
|
|
|
|
| |
|
|
|
|
| |
|
|
|
|
| |
|
|
|
|
|
|
|
|
|
| |
|
|
|
|
|
|
|
|
|
|
|
|
|
|
| |
|
|
|
|
|
|
|
|
|
|
|
|
|
|
| |
|
|
|
|
|
|
|
|
|
|
|
|
|
|
| |
|
|
|
|
|
|
|
|
|
|
|
|
|
|
| |
|
|
|
|
|
|
|
|
|
|
|
|
|
|
| |
|
|
|
|
|
|
|
|
|
|
|
|
|
|
| |
|
|
|
|
|
|
|
|
|
|
|
|
|
|
| |
|
|
|
|
|
|
|
|
|
|
|
|
|
|
| |
|
|
|
|
|
|
|
|
|
|
|
|
|
|
| |
|
|
|
|
|
|
|
|
|
|
|
|
|
|
| |
|
|
|
|
|
|
|
|
|
|
|
|
|
|
| |
|
|
|
|
|
|
|
|
|
|
|
|
|
|
| |
|
|
|
|
|
|
|
|
|
|
|
|
|
|
| |
|
|
|
|
|
|
|
|
|
|
|
|
|
|
| |
|
|
|
|
|
|
|
|
|
|
|
|
|
|
| |
|
|
|
|
|
|
|
|
|
|
|
|
|
|
| |
|
|
|
|
|
|
|
|
|
|
|
|
|
|
| |
|
|
|
|
|
|
|
|
|
|
|
|
|
|
| |
|
|
|
|
|
|
|
|
|
|
|
|
|
|
| |
|
|
|
|
|
|
|
|
|
|
|
|
|
|
| |
|
|
|
|
|
|
|
|
|
|
|
|
|
|
| |
|
|
|
|
|
|
|
|
|
|
|
|
|
|
| |
|
|
|
|
|
|
|
|
|
|
|
|
|
|
| |
|
|
|
|
|
|
|
|
|
|
|
|
|
|
|
|
|
|
|
|
|
|
|
|
|
|
|
|
|
| |
|
|
|
|
|
|
|
|
|
|
|
|
|
|
| |
|
|
|
|
|
|
|
|
|
|
|
|
|
|
| |
|
|
|
|
|
|
|
|
|
|
|
|
|
|
| |
|
|
|
|
|
|
|
|
|
|
|
|
|
|
| |
|
|
|
|
|
|
|
|
|
|
|
|
|
|
| |
|
|
|
|
|
|
|
|
|
|
|
|
|
|
| |
|
|
|
|
|
|
|
|
|
|
|
|
|
|
| |
|
|
|
|
|
|
|
|
|
|
|
|
|
|
| |
|
|
|
|
|
|
|
|
|
|
|
|
|
|
| |
|
|
|
|
|
|
|
|
|
|
|
|
|
|
| |
|
|
|
|
|
|
|
|
|
|
|
|
|
|
| |
|
|
|
|
|
|
|
|
|
|
|
|
|
|
| |
|
|
|
|
|
|
|
|
|
|
|
|
|
|
| |
|
|
|
|
|
|
|
|
|
|
|
|
|
|
| |
|
|
|
|
|
|
|
|
|
|
|
|
|
|
| |
|
|
|
|
|
|
|
|
|
|
|
|
|
|
| |
|
|
|
|
|
|
|
|
|
|
|
|
|
|
| |
|
|
|
|
|
|
|
|
|
|
|
|
|
|
| |
|
|
|
|
|
|
|
|
|
|
|
|
|
|
| |
|
|
|
|
|
|
|
|
|
|
|
|
|
|
| |
|
|
|
|
|
|
|
|
|
|
|
|
|
|
| |
|
|
|
|
|
|
|
|
|
|
|
|
|
|
| |
|
|
|
|
|
|
|
|
|
|
|
|
|
|
| |
|
|
|
|
|
|
|
|
|
|
|
|
|
|
| |
|
|
|
|
|
|
|
|
|
|
|
|
|
|
| |
|
|
|
|
|
|
|
|
|
|
|
|
|
|
| |
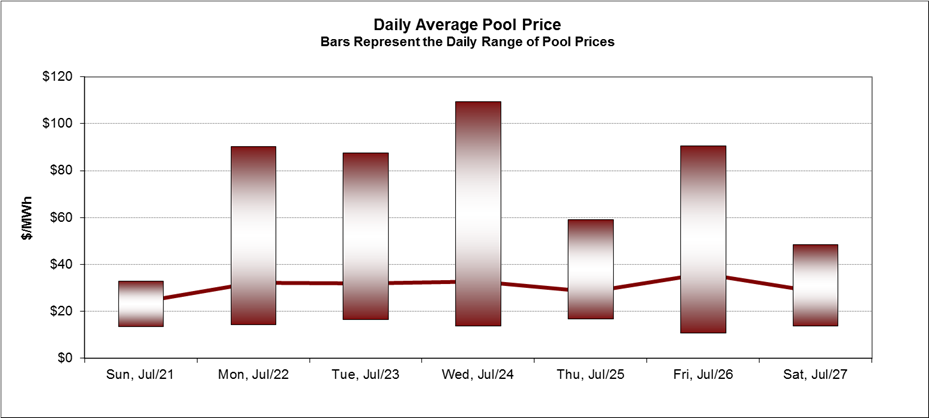
Pool Summary Table |
|
|
|
|
| |
|
Pool Price ($/MWh) |
|
Pool Demand (MW) |
Total Energy (MWh) |
|
|
|
|
| |
Date |
Minimum |
Average |
Maximum |
Weighted Average* |
Minimum |
Average |
Maximum |
|
|
|
|
| |
Sun, Jul-21 |
$13.58 |
$24.03 |
$33.02 |
$24.34 |
7,579 |
8,365 |
8,954 |
200,758 |
|
|
|
|
| |
Mon, Jul-22 |
$14.41 |
$32.22 |
$90.44 |
$33.18 |
7,799 |
8,841 |
9,576 |
212,174 |
|
|
|
|
| |
Tue, Jul-23 |
$16.66 |
$31.80 |
$87.78 |
$32.67 |
7,790 |
8,807 |
9,564 |
211,356 |
|
|
|
|
| |
Wed, Jul-24 |
$13.77 |
$32.72 |
$109.48 |
$33.48 |
7,767 |
8,764 |
9,502 |
210,335 |
|
|
|
|
| |
Thu, Jul-25 |
$16.91 |
$28.33 |
$59.19 |
$28.96 |
7,759 |
8,707 |
9,355 |
208,964 |
|
|
|
|
| |
Fri, Jul-26 |
$10.76 |
$35.92 |
$90.69 |
$37.02 |
7,708 |
8,704 |
9,425 |
208,886 |
|
|
|
|
| |
Sat, Jul-27 |
$13.77 |
$28.31 |
$48.48 |
$28.63 |
7,607 |
8,290 |
8,798 |
198,962 |
|
|
|
|
| |
|
|
|
|
|
|
| |
Week |
$10.76 |
$30.48 |
$109.48 |
$31.25 |
7,579 |
8,639 |
9,576 |
1,451,435 |
|
|
|
|
| |
Occurred On |
Fri, Jul-26 HE 04 |
|
Wed, Jul-24 HE 12 |
|
Sun, Jul-21 HE 07 |
|
Mon, Jul-22 HE 14 |
|
|
|
|
|
| |
* - Weighted
average pool price is calculated as the sum of the hourly pool demand times
the pool price, divided by the total demand |
|
|
|
|
| |
|
|
|
|
|
|
|
|
|
|
|
|
|
|
|
|
|
|
|
|
|
|
|
|
|
|
|
|
|
|
|
|
|
|
|
|
|
|
|
|
|
|
|
|
|
|
|
|
|
|
|
|
|
|
|
|
|
|
|
|
|
|
|
|
|
|
|
|
|
|
|
|
|
|
|
|
|
|
|
|
|
|
|
|
|
|
|
|
|
|
|
|
|
|
|
|
|
|
|
|
|
|
|
|
|
|
|
|
|
|
|
|
|
|
|
|
|
|
|
|
|
|
|
|
|
|
|
|
|
|
|
|
|
|
|
|
|
|
|
|
|
|
|
|
|
|
|
|
|
|
|
|
|
|
|
|
|
|
|
|
|
|
|
|
|
|
|
|
|
|
|
|
|
|
|
|
|
|
|
|
|
|
|
|
|
|
|
|
|
|
|
|
|
|
|
|
|
|
|
|
|
|
|
|
|
|
|
|
|
|
|
|
|
|
|
|
|
|
|
|
|
|
|
|
|
|
|
|
|
|
|
|
|
|
|
|
|
|
|
|
|
|
|
|
|
|
|
|
|
|
|
|
|
|
|
|
|
|
|
|
|
|
|
|
|
|
|
|
|
|
|
|
|
|
|
|
|
|
|
|
|
|
|
|
|
|
|
|
|
|
|
|
|
|
|
|
|
|
|
|
|
|
|
|
|
|
|
|
|
|
|
|
|
|