Weekly Graphs: June 21, 2009 to June
27, 2009

AESO Weekly Report
21-June-09 to 27-June-09
|
Pool
Prices ($/MWh) |
Occurred
on: |
|||||||||
|
Day |
21-Jun |
22-Jun |
23-Jun |
24-Jun |
25-Jun |
26-Jun |
27-Jun |
Week |
Date |
Hr |
|
|
|
|
|
|
|
|
|
|
|
|
|
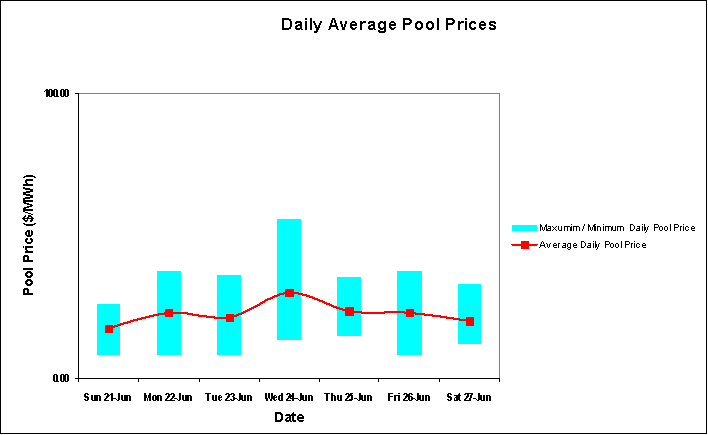
Minimum |
7.85 |
7.93 |
7.86 |
13.23 |
14.57 |
7.85 |
11.96 |
7.85 |
21-Jun |
5 |
|
Maximum |
26.06 |
37.58 |
36.38 |
56.00 |
35.52 |
37.56 |
33.10 |
56.00 |
24-Jun |
17 |
|
Daily Average |
17.53 |
23.05 |
21.31 |
30.14 |
23.56 |
23.00 |
20.03 |
22.66 |
|
|
|
Weighted Average* |
17.80 |
23.76 |
22.00 |
31.16 |
24.14 |
23.80 |
20.30 |
23.34 |
|
|
|
|
|
|
|
|
|
|
|
|
|
|
|
System
Demand (MW) |
Occurred
on: |
|||||||||
|
Day |
21-Jun |
22-Jun |
23-Jun |
24-Jun |
25-Jun |
26-Jun |
27-Jun |
Week |
Date |
Hr |
|
|
|
|
|
|
|
|
|
|
|
|
|
Minimum |
6,872 |
6,931 |
6,664 |
6,749 |
6,862 |
6,776 |
6,802 |
6,664 |
23-Jun |
5 |
|
Maximum |
7,869 |
8,439 |
8,415 |
8,651 |
8,694 |
8,560 |
7,938 |
8,694 |
25-Jun |
13 |
|
|
|
|
|
|
|
|
|
|
|
|
|
Energy
Traded (MWh) |
|
|
||||||||
|
Day |
21-Jun |
22-Jun |
23-Jun |
24-Jun |
25-Jun |
26-Jun |
27-Jun |
Week |
|
|
|
Total |
179,669 |
186,443 |
184,305 |
188,491 |
189,406 |
187,147 |
179,020 |
1,294,481 |
|
|
*Weighted Average is calculated
as summation of hourly pool price ($/MWh) multiplied
by hourly Demand (MWh), this total is then divided by
the summation of hourly demand (MWh).
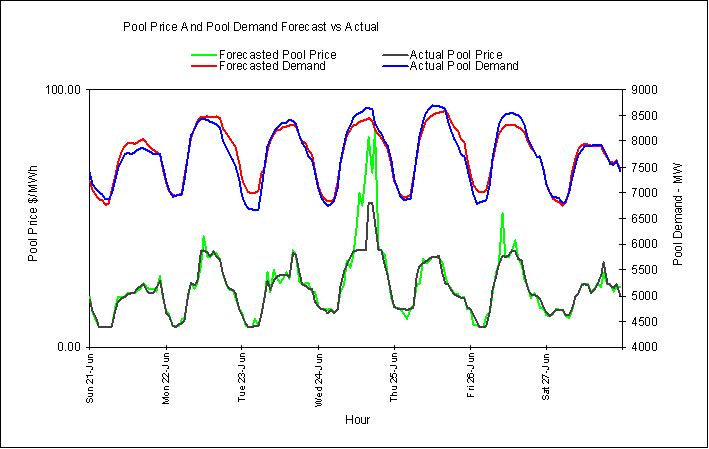
The weekly system peak
demand was 8,694 MW and total energy demand was 1,294 GWh as compared to the
previous week's 8,863 MW and 1,325 GWh.
The weekly maximum pool
price was 56.00 $/MWh versus the previous
week's 226.57 $/MWh.
Highlights:
|
Date |
Time |
Event |
|
June 22, 2009 |
11:33 |
Keephills #1 off line. |
|
June 25, 2009 |
14:51 |
Keephills #1 on line. |
|
June 27, 2009 |
18:21 |
Sundance #4 off line. |
Prepared on June 29th, 2009
|
|
|
2500, 330
– 5th Avenue SW |
Copyright Alberta Electric System
Operator. ©2003. All rights reserved.