Operations Report for July 2006
The
Market
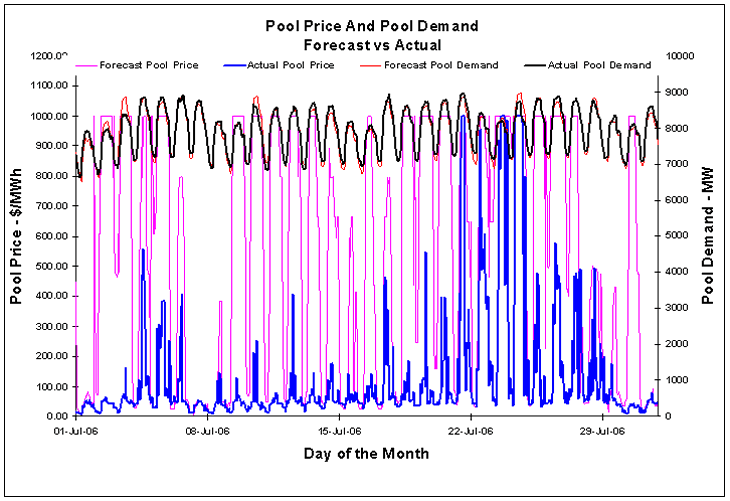
The Alberta integrated system Peak Demand and the
Total Energy Consumption in July 2006
were 8,966 MW and 5,893 GWh, compared to 8,906 MW and 5,448 GWh in June, 2006.
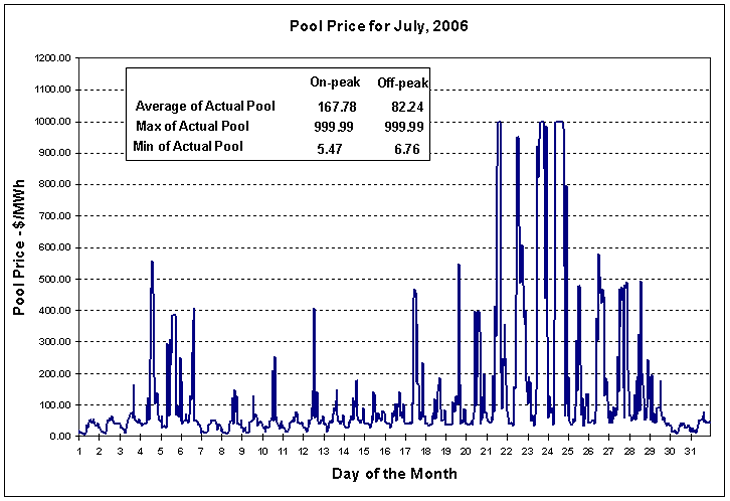
On-peak* Pool Prices varied from 5.47 to 999.99 $/MWh and Off-peak* varied from 6.76 to 999.99 $/MWh.
(* On-peak and Off-peak Hours as defined by
the Western Electricity Coordinating Council (WECC),
On-peak Hours: HE 08:00 - HE 23:00 MST Monday through Saturday inclusive,
Off-peak Hours are the remaining hours Monday through Saturday, Sunday and
statutory holidays in WECC.)
Report prepared on August 1, 2006.
![]()
Statistics:
|
Alberta Electric System Operator Monthly Report Sat, 01-Jul-2006 to Mon, 31-Jul-2006 |
|||||||||
|
|
Pool
Prices ($/MWh) |
|
Pool
Demand (MW) |
|
Total
Demand |
||||
|
Day |
Minimum |
Maximum |
Average |
Minimum |
Maximum |
Average
* |
(MWh) ** |
||
|
1 |
5.47 |
55.94 |
30.11 |
6,627 |
7,911 |
7,396 |
177,507 |
||
|
2 |
7.18 |
64.86 |
35.14 |
6,703 |
7,983 |
7,459 |
179,018 |
||
|
3 |
10.00 |
163.93 |
48.22 |
6,889 |
8,375 |
7,791 |
186,987 |
||
|
4 |
33.00 |
555.75 |
143.75 |
7,100 |
8,868 |
8,129 |
195,085 |
||
|
5 |
26.43 |
384.00 |
160.53 |
7,203 |
8,866 |
8,156 |
195,740 |
||
|
6 |
29.79 |
406.47 |
97.54 |
7,188 |
8,917 |
8,177 |
196,247 |
||
|
7 |
10.16 |
53.75 |
30.69 |
7,289 |
8,768 |
8,111 |
194,665 |
||
|
8 |
6.76 |
146.98 |
43.36 |
6,871 |
8,183 |
7,691 |
184,592 |
||
|
9 |
10.14 |
127.60 |
41.84 |
6,897 |
8,150 |
7,624 |
182,983 |
||
|
10 |
15.79 |
252.91 |
54.64 |
6,992 |
8,672 |
7,901 |
189,618 |
||
|
11 |
11.62 |
77.64 |
39.62 |
6,816 |
8,571 |
7,820 |
187,682 |
||
|
12 |
14.85 |
405.99 |
71.31 |
6,955 |
8,611 |
7,873 |
188,962 |
||
|
13 |
14.81 |
148.04 |
53.46 |
6,854 |
8,690 |
7,917 |
190,013 |
||
|
14 |
24.50 |
175.66 |
64.70 |
7,066 |
8,612 |
7,960 |
191,039 |
||
|
15 |
26.37 |
140.70 |
59.57 |
6,998 |
8,181 |
7,716 |
185,182 |
||
|
16 |
25.07 |
140.66 |
64.33 |
6,918 |
8,089 |
7,593 |
182,230 |
||
|
17 |
37.00 |
465.00 |
140.53 |
7,093 |
8,921 |
8,088 |
194,117 |
||
|
18 |
32.00 |
186.66 |
66.06 |
7,085 |
8,618 |
7,991 |
191,776 |
||
|
19 |
35.00 |
548.84 |
89.99 |
7,090 |
8,755 |
8,037 |
192,880 |
||
|
20 |
36.26 |
397.37 |
126.38 |
7,257 |
8,777 |
8,160 |
195,835 |
||
|
21 |
43.99 |
999.99 |
309.81 |
7,212 |
8,966 |
8,233 |
197,599 |
||
|
22 |
33.07 |
951.39 |
353.53 |
7,295 |
8,426 |
7,935 |
190,430 |
||
|
23 |
33.82 |
999.99 |
475.15 |
7,124 |
8,216 |
7,746 |
185,896 |
||
|
24 |
35.50 |
999.99 |
525.72 |
7,144 |
8,740 |
8,027 |
192,647 |
||
|
25 |
32.07 |
477.50 |
151.78 |
7,238 |
8,817 |
8,134 |
195,204 |
||
|
26 |
41.85 |
578.47 |
205.42 |
7,266 |
8,887 |
8,208 |
196,997 |
||
|
27 |
42.25 |
490.33 |
219.20 |
7,240 |
8,833 |
8,162 |
195,897 |
||
|
28 |
47.63 |
494.35 |
139.37 |
7,353 |
8,778 |
8,107 |
194,562 |
||
|
29 |
34.01 |
197.02 |
69.74 |
7,139 |
8,360 |
7,795 |
187,088 |
||
|
30 |
7.31 |
43.01 |
26.32 |
6,974 |
8,106 |
7,623 |
182,946 |
||
|
31 |
10.80 |
76.42 |
37.30 |
7,063 |
8,599 |
7,962 |
191,084 |
||
|
Monthly
Value |
5.47 |
999.99 |
128.23 |
6,627 |
8,966 |
7,920 |
5,892,508 |
||
|
|
|
|
|||||||
|
Occurred
on: |
|
|
|
|
|
|
|
||
|
Day |
1 |
21 |
|
1 |
21 |
|
177,507 |
||
|
Hour |
8 |
15 |
|
6 |
15 |
|
|
||
*
Average of hourly Pool Demands during the day.
**
Sum of hourly Pool Demands for the day.
As
this report is produced shortly after the end of the month, the data may not be
final and is supplied for information purposes only.
![]()
![]()
|
|
|
|
Copyright AESO. ©2001. All rights reserved.